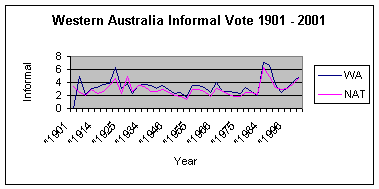
Western Australia
Updated: 22 December 2010
WESTERN AUSTRALIA
| Number of divisions: 15 |
% |
| Enrolled |
1 206 422 |
|
| Turnout |
1 140 922 |
94.57 |
| Number of static polling booths |
795 |
|
| Number of special hospital teams |
55 |
|
| Number of pre poll centres |
49 |
|
| ALP TCP |
524 825 |
48.38 |
| NON ALP TCP |
559 970 |
51.62 |
| Informal |
56 134 |
4.92 |
Informal votes by category
| Category |
Ballot Papers |
% |
1996 |
| Blanks |
13 120 |
23.36 |
24.34 |
| Number '1' only |
16 776 |
29.87 |
36.26 |
| Ticks and crosses |
5 578 |
9.93 |
23.34 |
| Langer style |
2 347 |
4.18 |
|
| Non sequential |
12 218 |
21.75 |
|
| Voter identified |
63 |
0.11 |
0.02 |
| Marks |
4 371 |
7.78 |
13.89 |
| Slogans making numbering illegible |
101 |
0.18 |
|
| Other |
1 590 |
2.83 |
|
| Total |
56 164 |
4.92 |
3.16 |
Specific data
| |
|
Total votes |
Total informal |
% |
| Highest % informal division |
O'Connor |
79 208 |
4 693 |
5.92 |
| Lowest % informal division |
Curtin |
78 477 |
2 590 |
3.30 |
| Absent votes |
|
91 299 |
4 439 |
4.86 |
| Postal votes |
|
33 487 |
561 |
1.68 |
| Pre poll votes |
|
43 816 |
1 111 |
2.54 |
| Provisional votes |
|
6 756 |
416 |
6.16 |

Informal Votes By Division


