Skip to contentInformation for people with disabilityInformation on accessibility

Australian Electoral Commission


| Number of divisions: 12 | % | |
|---|---|---|
| Enrolled | 1 039 025 | |
| Turnout | 992 747 | 95.55 |
| Number of static polling booths | 651 | |
| Number of special hospital teams | 54 | |
| Number of pre poll centres | 41 | |
| ALP TCP | 430 558 | 45.92 |
| NON ALP TCP | 507 149 | 54.08 |
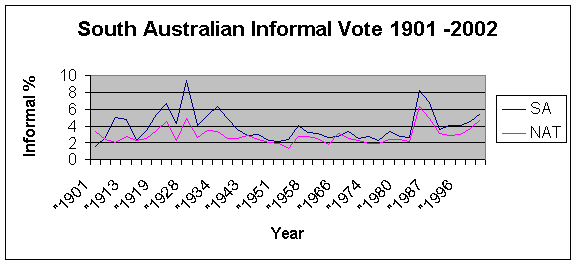
| Informal | 55 040 | 5.54 |
| Category | Ballot Papers | % | 1996 |
|---|---|---|---|
| Blanks | 13 495 | 24.52 | 28.13 |
| Number '1' only | 20 164 | 36.64 | 37.64 |
| Ticks and crosses | 8 360 | 15.19 | 23.74 |
| Langer style | 527 | 0.96 | |
| Non sequential | 7 573 | 13.76 | |
| Voter identified | 17 | 0.03 | 0.02 |
| Marks | 3 614 | 6.57 | 9.74 |
| Slogans making numbering illegible | 19 | 0.03 | |
| Other | 1 293 | 2.35 | |
| Total | 55 040 | 5.54 | 2.35 |
| Total votes | Total informal | % | ||
|---|---|---|---|---|
| Highest % informal division | Bonython | 81 596 | 5 984 | 7.33 |
| Lowest % informal division | Boothby | 85 795 | 3 880 | 4.52 |
| Absent votes | 60 307 | 3,208 | 5.32 | |
| Postal votes | 36 460 | 677 | 1.86 | |
| Pre poll votes | 32 773 | 952 | 2.90 | |
| Provisional votes | 6 154 | 508 | 8.25 |
