Skip to contentInformation for people with disabilityInformation on accessibility

Following each general election for the House of Representatives, the Australian Electoral Commission (AEC) undertakes an Informal Ballot Paper Study (IBPS) to analyse the levels and types of informal voting. Research based on the IBPS is fundamental to the AEC’s role in supporting electoral integrity by:
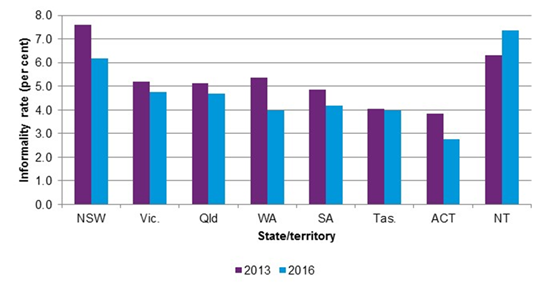
The national informality rate (informal votes as a percentage of all votes cast) decreased from 5.91 per cent of all votes cast at the 2013 House of Representatives elections to 5.05 per cent at the 2016 House of Representatives elections. At the state and territory level, the highest informality rates for the 2016 House of Representatives elections were in the Northern Territory, New South Wales and Victoria, while the lowest informality rates were in the Australian Capital Territory, Tasmania and Western Australia.
(Australian Electoral Commission, 2013; 2016f)
Compared with the 2013 House of Representatives elections, informality rates decreased in every state and territory other than the Northern Territory.
The largest decreases were in New South Wales, Western Australia and the Australian Capital Territory.
For the first time since 2001, the ten Commonwealth electoral divisions with the highest levels of House of Representatives informality were not all located in Sydney. While eight of these divisions were in Sydney (Lindsay, Blaxland, Watson, Fowler, McMahon, Parramatta, Werriwa and Barton), the two other divisions were located in Victoria (Murray) and Queensland (Longman).
Major process improvements for the 2016 IBPS (including data based on scanned ballot paper images) have improved data quality and the range of analyses that can be conducted, but mean that caution should be used when comparing 2016 results against previous years.
For the first time since 2001, more than half of all informal ballots cast at the 2016 House of Representatives elections were assumed to be intentionally informal. However, among the ten divisions with the highest rates of informal voting, more than half of all informal ballots were assumed to be unintentionally informal, and assumed unintentional informality was a highly significant predictor of the total informality rate.
More than a quarter of all informal votes cast in 2016 had incomplete numbering, with more than half of these showing a number ‘1’ only. A further quarter of all informal ballots cast were totally blank, while about one in five were informal due to scribbles, slogans or other protest vote marks and one in six showed non-sequential numbering.
Table 1 below summarises the number of informal votes in each category, as well as the proportion each category represents of the total number of informal votes and of the total of all votes cast.
| Category | Clear first preference no. |
No clear first preference no. |
Total | Informality rate % |
|
|---|---|---|---|---|---|
| no. | % | ||||
| Totally blank | .. | 179,243 | 179,243 | 24.9 | 1.26 |
| Incomplete numbering | 183,183 | .. | 183,183 | 25.4 | 1.28 |
| Number ‘1’ only | 105,093 | .. | 105,093 | 14.6 | 0.74 |
| Other incomplete numbering | 78,090 | .. | 78,090 | 10.8 | 0.55 |
| Ticks and crosses | 48,444 | 6,677 | 55,121 | 7.6 | 0.39 |
| Other symbols | 9,458 | 1,678 | 11,136 | 1.5 | 0.08 |
| Non-sequential numbering | 84,960 | 26,055 | 111,015 | 15.4 | 0.78 |
| Scribbles, slogans and other protest vote marks | .. | 142,933 | 142,933 | 19.8 | 1.00 |
| Illegible numbering | 12,083 | 7,652 | 19,735 | 2.7 | 0.14 |
| Voter identified | 117 | .. | 117 | 0.0 | 0.00 |
| Other | 5,085 | 13,347 | 18,432 | 2.6 | 0.13 |
| Total | 343,330 | 377,585 | 720,915 | 100.0 | 5.05 |
(Australian Electoral Commission, 2018a).
There are many factors that appear to affect informal voting at the House of Representatives. Over the past few elections the Australian Electoral Commission (AEC) has investigated a variety of factors using both AEC and Australian Bureau of Statistics (ABS) data.
While the AEC does not usually conduct studies of by-election informality, the 45th Parliament has had an unusually high number of by-elections, providing the opportunity to examine some specific factors affecting informality. In order to examine the effect of confusion over the Senate voting system and the effect of not having a candidate from a major party, the AEC conducted studies on the Longman and Fremantle by-elections respectively.
These analyses have found that:
The AEC acknowledges the Traditional Owners of Country throughout Australia and recognises their continuing connection to land, waters, culture and community. We pay our respects to Elders past, present and emerging.